Tuesday, August 12, 2008

GBP/JPY, a reversal sign

Our lovely cross GBP/JPY just gave us a very nice long term sell signal which is just waiting for confirmation right now, from the chart below “weekly chart” we could detect two types of sell signals:

1- A hang man weekly candle was formed on 20 - 24 July, 2008 .

2- Trend line breakout we was expecting last week and has already done this week.

The third signal would be a moving averages cross-over we are waiting for.

From the daily chart we suggest to take a sell position from the current price area “under 210.65″ with a small amount as it may try to go up trying to test the broken trend again, there we can go add more short positions, our first target would be 206.60 - 207.00, second target would be 204.60 and the last target would be 198.15 - 201.50 area and i recommend 199.60 which was a good support for it always, our stop loss would be above 213.50
Friday, July 25, 2008

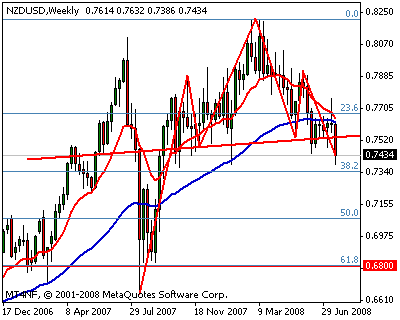
KIWI, Head&Shoulders detected


As Chart shows us, kiwi formed a Head & Shoulders pattern on the weekly chart, while daily studies somehow show that it’s heavily sold which gives us a sign for an expected pullback to 0.7550 - 0.7620 which would be a neck line test, i think a closing under the neck line suggesting to open some shorting positions and waiting for a retracement to the mentioned above area for opening more short positions, targetting 0.68xx area.

Moving Averages 13, 52 is so near now, a cross-over would be another sell sign, while target point “0.6800″ is 61.8 fibonacci line from 28 th. June 2006 low “0.5928″ till 9 th. March 2008 High “0.8214″ and at the same time Head & Shoulders expected target.

Last word to be said is “take care”, it’s a long term trade so we would taking our positions with a small amounts.

Wednesday, May 14, 2008

Metals: Strong Golden Bear


A
ll what changed are:
1- Gold tested neck line already, which was the upper downtrend channel line, this was a confirmation for the down direction.
2- A line was added "Trading line", the pink one, this is the line it tests always for medium term trading.
3- We have now 2 points to care about, 844 "last bottom" and 834.50 "50%" Fibonacci level.
Same points targeted and keep an eye for breaking above the down channel for stopping loss.

Sunday, April 27, 2008

Metals : Gold selling new hobby!

Confirming my previous analysis, gold is sliding down so fast, panic is continuing pushing gold down and down to its critical point, it's 38.6% fibonacci level and neck line, that's it, a retracement or a big free fall, but which side is it supposed to be?
A down trend channel already confirmed, it's top line now on 918-922$, so a retracement will not be effective for our shorting positions, it would be dangerous if it break through that level and give a confirmation over 928$ which will support it till 953$, but i don't expect a scenario like this, the one i expect would be a break down through that critical point, taking out the next weak support "872$", what more??!, do dream it yourself, we would having 842$, 789$ and 718$ as a final target for gold.
One thing left to be told, keep your opened short positions, and if you want to be greedy, let's open more after closing under 882$, selling now is a hobby more than just a trading style, at least at the moment, wake up gold lovers.

Saturday, April 19, 2008

Metals : Gold selling panic would continue, part II


As we expected our first target was done when gold reached 872$/Oz, after that it retraced to 952$/Oz the area which capped it 2 times before, and as we expected it wasn't able to break into that level, once it touched it, it reversed back down again targeting support level "905" which we referred to last time, and it touched 904.30, retraced to close at 917$, but now, what is coming??!

This chart tells us that, price was capped three times under 952 price area, which is now a very hard resistance for gold to break above, it went down and tipped 904.30 "905 support key", retraced a little to 917, looking at these inputs, aside with all fundamental inputs, daily chart gives us a strong signal that gold will continue its way down, we have 2 scenarios:

1- Breaking of 882 and closing under it will give us a confirmation for forming a head & shoulders which would be targetting 718$/Oz

2- Breaking 872 "last bottom" will confirm wave (C) begining which will target 842$ at least later 789$.

As i said in previous analysis, it's over for gold for now, rally ended.

Sunday, March 30, 2008

Metals : Gold selling panic would continue!


The yellow metal, the one every one loves and a lot die for, is under selling pressure right now, by looking to its chart we could notice how are people afraid since it touched 1000$/Oz, it couldn't handle being above 1000$ for more than a night or two as every time it passes this level it retraces quickly.
March 19th. candle was an aggressive bearish one with a trend breaking sign confirmed with the following candle which was out the uptrend completely and which gave more power for bears, Fibonacci studies tell us about our targets of shorting it with 882.50 as a first target "keep an eye of 904-last Thursday's low", 840 as a second target and 790 as a third target while, Elliott waves suggests a final target of 745, a way or another, it's over for gold for now, i think.